Strictly speaking, we all know that Long Island City is part of Queens. But the real estate boom there is giving us reason to wonder if makes more sense to evaluate it as if it were a Manhattan neighborhood. And it’s not just the aesthetics. It’s the numbers, too.
What’s Hot, What’s Sizzling
On 3/17/17, an article in The Real Deal described Long Island City and Flushing as being hot for condo development. The basis for that was the increase in the number of condominium plans filed with the New York State Attorney General; 121 for Long Island City and 56 for Flushing.
That’s all well and good. But there’s more to a market than numb er of plans on file. In fact, Long Island City and Flushing are completely different worlds.
For one thing, there are the obvious visuals. Long Island City looks a lot more like the sections of Manhattan that are being newly developed, such as Hell’s Kitchen (particularly where it borders the Upper West Side near 57th Street and 11th – West End Avenues) and the Hudson Yards, with a dash of lower Manhattan.
More importantly, though for buyers, unless something changes soon, most who want to be represented by brokers will probably find their way to Manhattan firms. At present, the Multi Listing Service operated by LIBOR (the Long Island Board of Realtors and the platform of choice for brokers in Queens) has only seven active co-op or condo listings (compared to 176 in Flushing). Meanwhile, Streeteasy.com, a key consumer-oriented site for Manhattan real estate, has 124 Long Island City listings and 89 in Flushing. To the extent the Streeteasy’s Long Island City listings resemble what’s on any sort of MLS, most are likely to be on platforms like OLR or Jaguar which, together with the Streeteasy and REBNY (Real Estate Board of New York) databases are as close as Manhattan gets nowadays to anything like an MLS. That probably means 6% brokerage commission are likely to be subtly baked into the offering prices. (Queens commissions tend to be noticeably lower, sometimes as low as 2%-3% and seldom above 4%).
Brokerage culture aside, though, the Long Island City valuations, to the extent they can be readily estimated, are much more Manhattan like.
Valuing Long Island City
 Valuing apartment by apartment is no more or less easy than would be the case anywhere else. But doing a mass valuation is touchy since LIBOR’s MLS, for which data is most readily accessible in analyzable format, has such a tiny sample. That said, I did what I could with what I have.
As per my recent series on co-op/condo valuation, prices are not every informative. To make proper comparisons, we need to standardize the apartment numbers in ways that control for differences in financial structure, particularly in the way building expenses, real estate taxes and mortgages are allocated. As discussed in my 3/13/17 post, there are three plausible measures:
- Gross monthly ownership costs
- Net (after-tax ) monthly ownership costs
- SMAC, a measure I developed that adjusts the net monthly cost based on apartment bedroom-bathroom configuration
I’ll use all three here.
Table 1 shows “representative” figures (the average of the mean and the median) for open offerings in Long Island City and Flushing. I also include a small – very, very, very small sampling of apartments in and near Midtown Manhattan I know of that I’d consider to be middle market (or perhaps the lower end of a broad middle range).
Table 1
| Monthly Occupancy Cost | SMAC | ||
| Gross | Net | ||
| Long Island City | 5,888 | 4,703 | 1,606 |
| Flushing | 2,467 | 1,953 | 771 |
| Manhattan Sample | 8,921 | 7,295 | 1,452 |
For added perspective, Table 2 adds areas in Queens that are also considered popular and, by Queens standards, high priced.
Table 2
| Monthly Occupancy Cost | SMAC | ||
| Gross | Net | ||
| Long Island City | 5,888 | 4,703 | 1,606 |
| Flushing | 2,467 | 1,953 | 771 |
| Manhattan Sample | 8,921 | 7,295 | 1,452 |
| Astoria | 2,917 | 2,310 | 1,054 |
| Elmhurst | 2,177 | 1,712 | 721 |
| Forest Hills | 2,450 | 1,990 | 881 |
| Jackson Heights | 2,240 | 1,782 | 857 |
| Kew Gardens | 1,892 | 1,516 | 844 |
| Rego Park | 2,343 | 1,853 | 858 |
| Woodside-Sunnyside | 2,013 | 1,595 | 806 |
SMAC, the most readily comparable measurement, shows that Flushing is actually just another part of Queens with its valuations relative to other parts of the borough being based more on differences between what buyers get than anything to do with a market being hot. Long Island City, on the other hand, is a completely different animal relative to its borough-mates, even its closest neighbor, Astoria.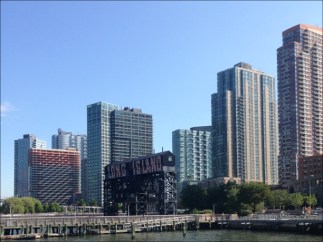
Over time, as Long Island City projects progress toward listing and sales, the numbers we see there may rise. Anecdotally, at least, it seems to me that many of the new units coming on stream are larger and offer more amenities than the units in my currently-meagre open-listing sample. While Long Island City valuations as not likely to catch up to reach Hudson Yards-Hell’s Kitchen levels, it’s not difficult for me to imagine them widening their already-extant lead over the plain-vanilla units I included in my Manhattan sample. If this holds up, Long Island City-Versus-Manhattan conversations won’t resemble Manhattan-versus-Queens conversations. Instead, they’ll be along the lines of Midtown West versus Upper West Side, Chelsea, etc.
Recent Movement
Tables 1 and 2 are based on currently open listings. Maybe sellers will get what they seek, or close to that. Maybe not. Table 3 shows how aspirational those asking prices are. It shows, for each measure in each neighborhood, how high (in percentage terms) representative asking valuations are above valuations of recently-consummated sales.
Table 3: Ask Valuations, % Above Recent Deals
| Monthly Occupancy Cost | SMAC | ||
| Gross | Net | ||
| Long Island City | 108 | 113 | 52 |
| Flushing | 20 | 21 | 4 |
| Astoria | 22 | 24 | 14 |
| Elmhurst | 10 | 10 | 14 |
| Forest Hills | 16 | 16 | 10 |
| Jackson Heights | 3 | 4 | 16 |
| Kew Gardens | 2 | 2 | 24 |
| Rego Park | 10 | 10 | 17 |
| Woodside-Sunnyside | -1 | 0 | 3 |
Judging from seller aspiration, Long Island City is, again, in a class by itself compared to other parts of Queens. Interestingly, though, It’s hard to argue that Flushing is at all hot, at least not any more. The dreamed-of prospective rise in valuations there seems quite skimpy, and is not likely to be helped by the projected increase in condominium supply.
